

Key Driver Analysis allows you to understand what drives your KPIs (brand perception & value, prescription probability, customer satisfaction, NPS, etc.). For example, with driver analysis you can extract “more juice” out of your existing brand tracker or customer data.
By understanding these drivers, you can better prioritize and shift marketing spend to optimize the impact on your KPIs.
Why SKIM Key Driver Analysis
Our advanced methodologies can overcome limitations that hinder traditional driver analysis approaches (such as multicollinearity and overfitting).
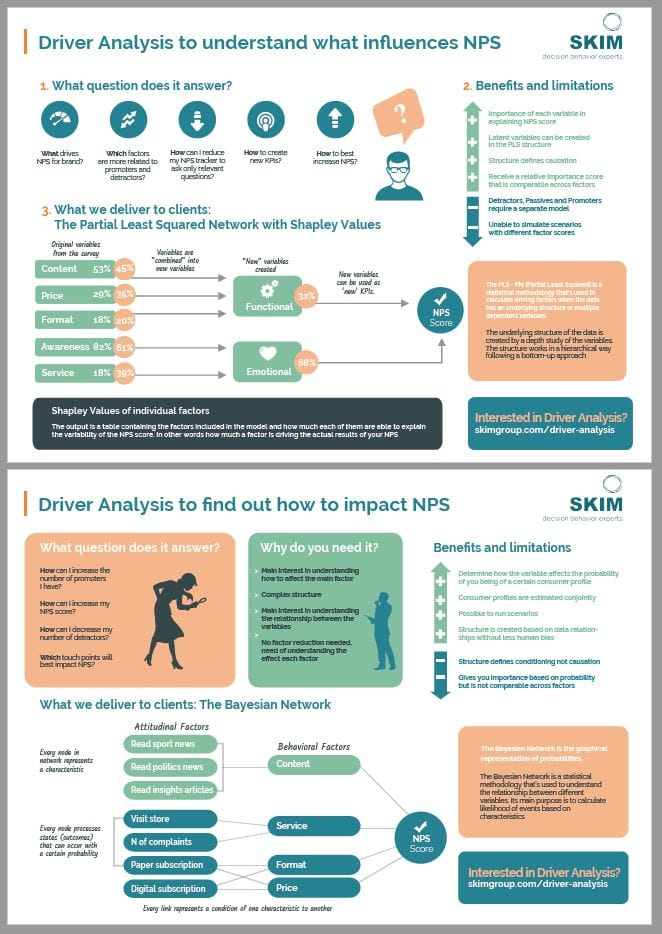
Based on your research objectives, budget and timeline, we can tailor the approach from less to more sophisticated tracking solutions. Common research techniques we employ include using Regression Shapley Values (simple, yet robust), Partial Least Squares (PLS), and Bayesian Networks (BN). The outputs vary based on the approach and can range from a simple table with factor sizes, to a full multi-layered model.
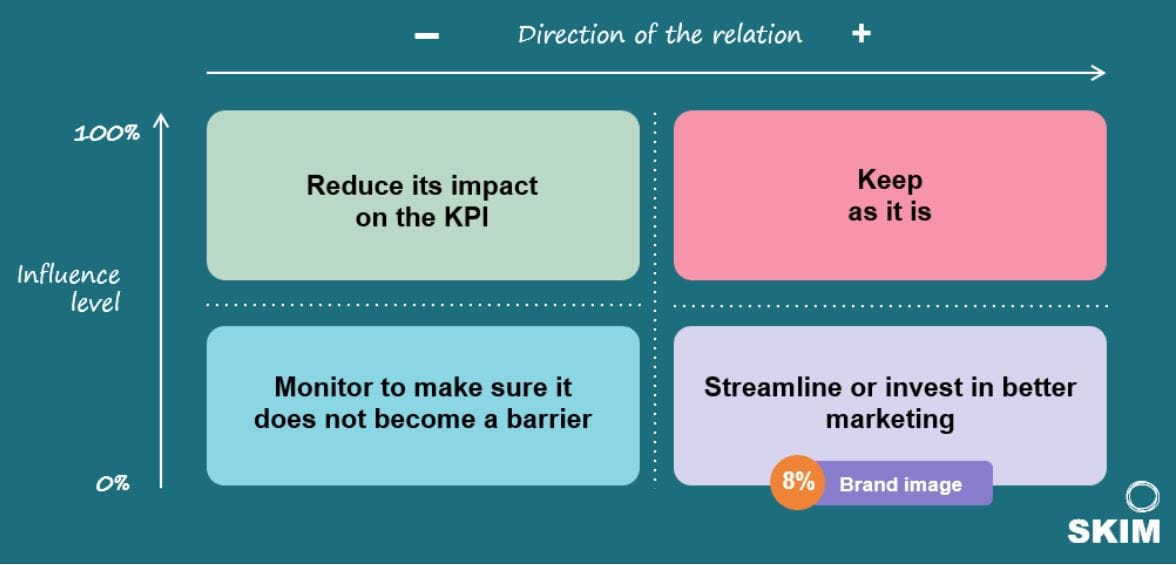
With this information, we can strategically advise on your best action for each driver depending on the direction of the relation with the dependent variable and the relative influence level of each factor.
What research techniques does Key Driver Analysis use?
Below are key research techniques we commonly employ for driver analysis.
Unstructured Path Modeling
- Shapley Values: comes from the game theory and it is based on multiple regressions. It provides the average factor influence, which is calculated as marginal contribution of a factor across all regression analysis that are performed.
- Elastic Net (Ridge + LASSO): this technique is usually used when the list of potential drivers is very long, and there is no structure (i.e. all drivers impact directly on the outcome); it is a modification of the traditional linear modelling, where the loss function uses specific penalization.
- Random Forests: A random forest sees prediction as a kind of tree. Instead of a tree splitting into branches, we split the data using attributes. These splits grow from each other, with a first level split and then a second split of that, creating a tree-like structure of sequential data splits. These splits are derived to build the most predictive tree and a random forest builds many of these trees by using random subsets of data and attributes. This tree-like sequence of data splits means that Random Forests need lots of data
Structured Path Modeling
- Partial Least Squared – PLS: Independent and dependent variables are organized in a path structure. Latent blocks are created, and the estimation provides average factor influence for each of the layers of the path and how much each variable influence the block in which it has been added.
- Structural Equation Modelling (SEM): SEM is similar to PLS in many ways. Both use a path diagram and derive the influence of each latent block. So the inputs and outputs look very similar. But their underlying analysis is very different. SEM is less of a predictive model. It is based on theoretical covariance matrices and their relationships, finding parameters that fit those to the data.
- Bayesian Network: Bayesian networks also model structural relationships between variables. Unlike PLS and SEM it does not need latent factors. BN models relationships between variables as conditional probabilities. It requires simulation to derive the importance of changing a specific variable on other variables.